 |
| Your stocks' attractiveness at a glance |
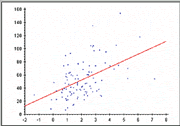 |
| See variables' linear regression |
5. Monitor your stocks with Hot Maps and Scatter Plots.
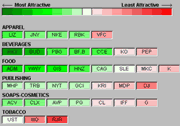
Now you can keep an eye on your investments at a glance. With Hot Map charts, stocks are ranked as colors (shades of green for the best to shades of red for the worst). That way, you’ll quickly spot the best and worst companies without an extra second of guesswork.
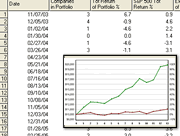
There's also a Scatter Plot that allows you to plot the linear regression of your selected variables.
6. Be alerted so you can act fast.
Research has proven that stock prices move before, during and after significant events. Stock prices may respond almost immediately, and they’re often affected up to 90 days afterward.
With just a few clicks of your mouse, you can easily check up on all of your stocks – and keep pace with fast-moving events that drive stock prices up or down.
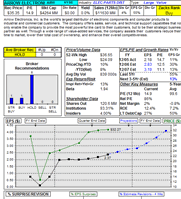 |
| Get the full picture on your stock |
7. Size up companies with Zacks Snapshots
Need to quickly see the full picture? Click on a single-company Snapshot Report in the Research Wizard. You’ll find a company description, actual and estimated EPS, company vs. industry ratings, fundamental data, broker recommendations, and price charts.
It’s all right in front of you – and, even better, it’s up to date.
8. Probe deeper with expanded Company Reports.
You can also delve into the expanded company reports that will be displayed in your browser. So you can profit from Fundamental Data Reports and Tables, Business Description and Management Discussion Reports, Insider Trading Data, Income Statements, Balance Sheets, Cash Flow Tables, Brokerage Research Reports and Abstracts, and more.
You can even view actual Statements or “Standardized” Reports. |
 Dear Investor:
 The program also comes loaded with some of our most successful stock-picking strategies. For example, the Momentum Method1 strategy has a +31.7% average yearly gain. Filtered Zacks Rank5 and BigMoneyZacks are earning +60.7% and +72.5% respectively.